Draft of Landscapes of Total Issues of Each Run at 9.4 Grade
Amazingly Secret Approach Using an Incredibly Novel Data Analysis Procedure for Comic Book Investing and Speculation.
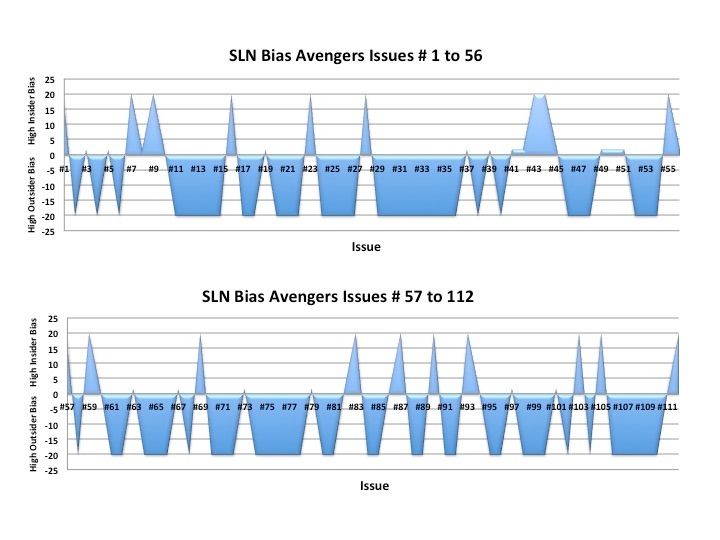
This blog represent part 2 of the wrap up of the 10 runs in this volume. I have mapped in landscape style the Y Axis of High I vs High O Bias Issues across the issue numbers listed. This given you insight into the entire length of the run. It's a way to compare runs as well. I suggest you study the patterns and think about questions these data may address.
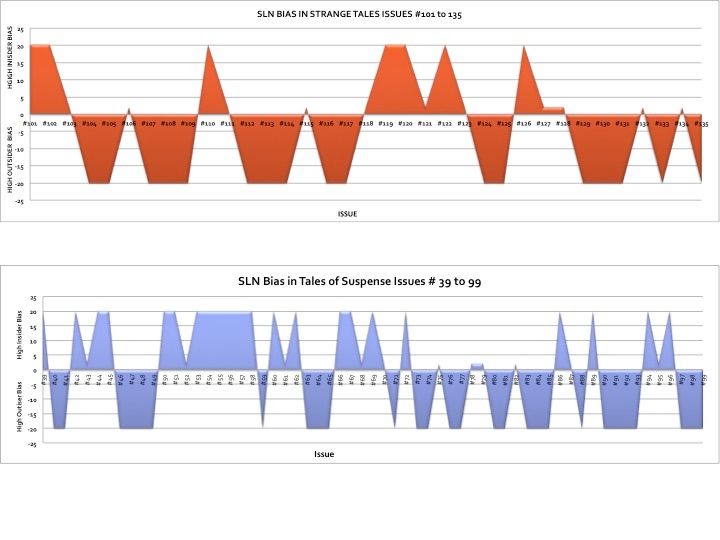
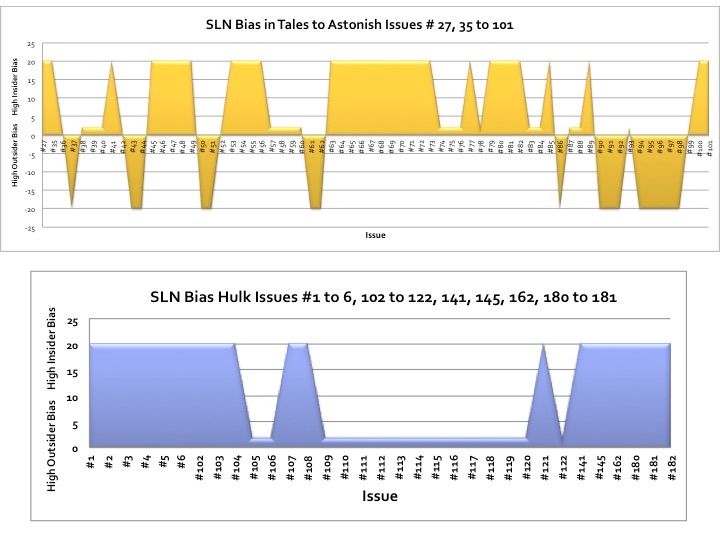
So look at TOS run we see a negative area from #73 to 86. In TTA we have a nice area of High I Bias from #52 to 60 and #63 to 85. As seen in Part 1 the TOS is currently the best one for investing. Hulk Issue seen to be neutral as alot of those issues are at 0.
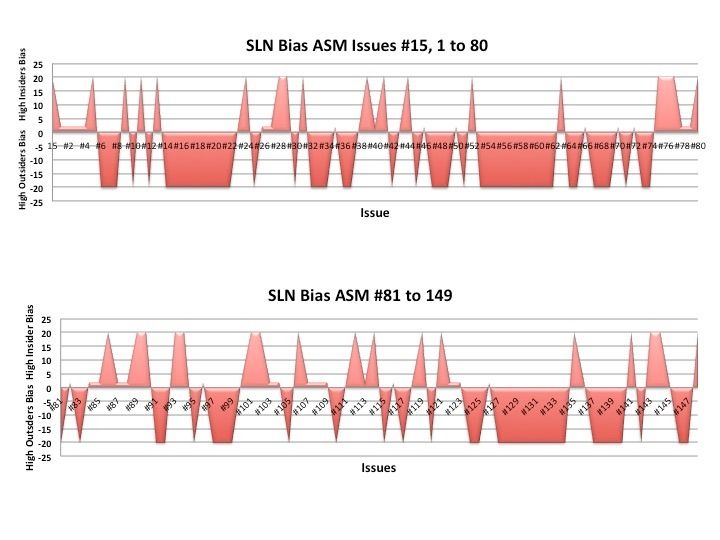
ASM was not the best run either with the key exceptions. This data cautions the investor to tread lightly and do your homework on the targets you have selected for potential investments.
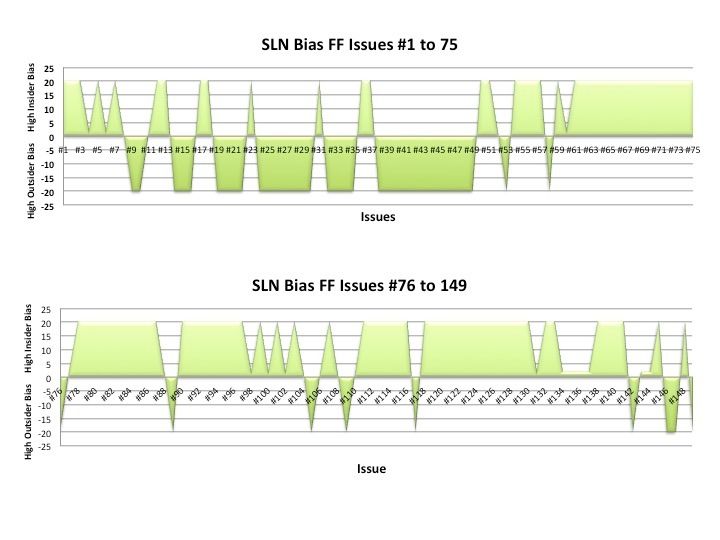
The FF run has a lot of strength later in the run which is usual. The data streams of B Score SLNs and ADFs considered especially for agreements. I have a score card concept that I use. I will add that feature to the block two groups of runs coming soon. I may go back into these runs and do a Score Card post. The blog is currently in lag phase and I am slowly picking up interest. My early readers will have an advantage. Use it well.
DD is the only run where the first issue is not I Biased into its SLN number. Given the 9.4 ADF which is I Biased that means the 8 and 6 grade data is really pulling down the overall profile. So SLN number that are high means the aggregate of the data is positive but it does not mean all of the grades are high. SLN numbers are summing the data across the grades.
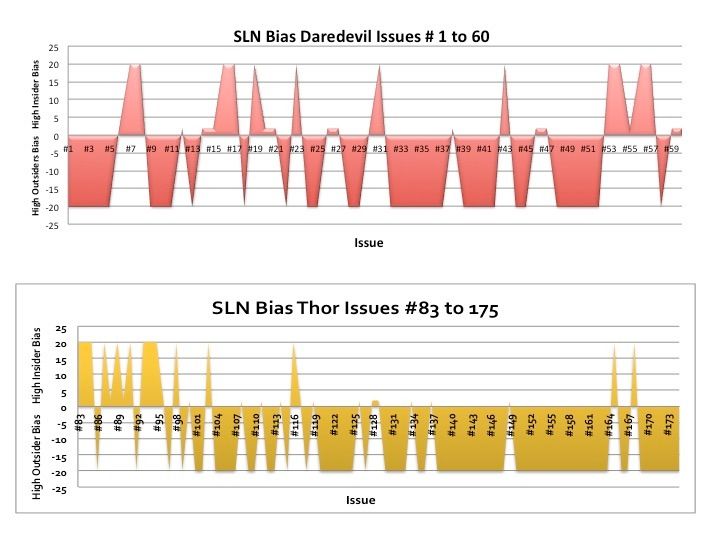
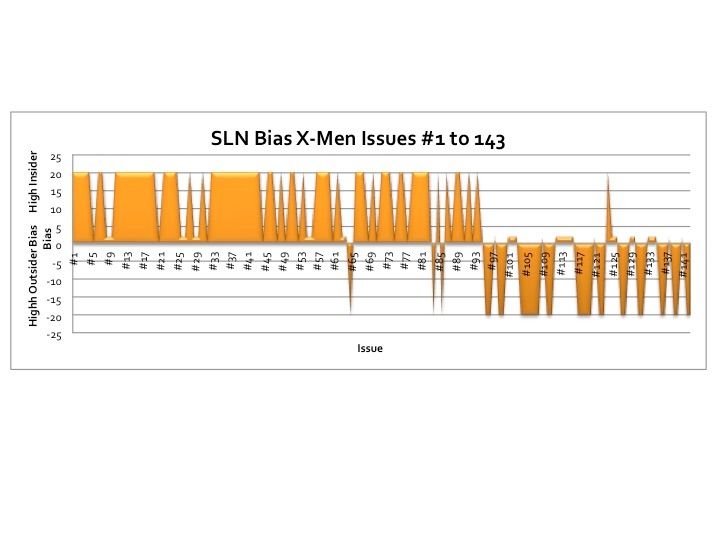
Compare Thor to X-Men. The X-men run has a broad support into the issue of 94 and then a collapse while Thor shows a much sooner collapse at 94. Interesting, is X-men more popular?
This blog represent part 2 of the wrap up of the 10 runs in this volume. I have mapped in landscape style the Y Axis of High I vs High O Bias Issues across the issue numbers listed. This given you insight into the entire length of the run. It's a way to compare runs as well. I suggest you study the patterns and think about questions these data may address.

So look at TOS run we see a negative area from #73 to 86. In TTA we have a nice area of High I Bias from #52 to 60 and #63 to 85. As seen in Part 1 the TOS is currently the best one for investing. Hulk Issue seen to be neutral as alot of those issues are at 0.

ASM was not the best run either with the key exceptions. This data cautions the investor to tread lightly and do your homework on the targets you have selected for potential investments.


The FF run has a lot of strength later in the run which is usual. The data streams of B Score SLNs and ADFs considered especially for agreements. I have a score card concept that I use. I will add that feature to the block two groups of runs coming soon. I may go back into these runs and do a Score Card post. The blog is currently in lag phase and I am slowly picking up interest. My early readers will have an advantage. Use it well.

DD is the only run where the first issue is not I Biased into its SLN number. Given the 9.4 ADF which is I Biased that means the 8 and 6 grade data is really pulling down the overall profile. So SLN number that are high means the aggregate of the data is positive but it does not mean all of the grades are high. SLN numbers are summing the data across the grades.

Compare Thor to X-Men. The X-men run has a broad support into the issue of 94 and then a collapse while Thor shows a much sooner collapse at 94. Interesting, is X-men more popular?


Comments
Post a Comment