Posts

Showing posts from May, 2017

Investment Analysis of FF #28 to 44. Focused Attention Suggested.

Image
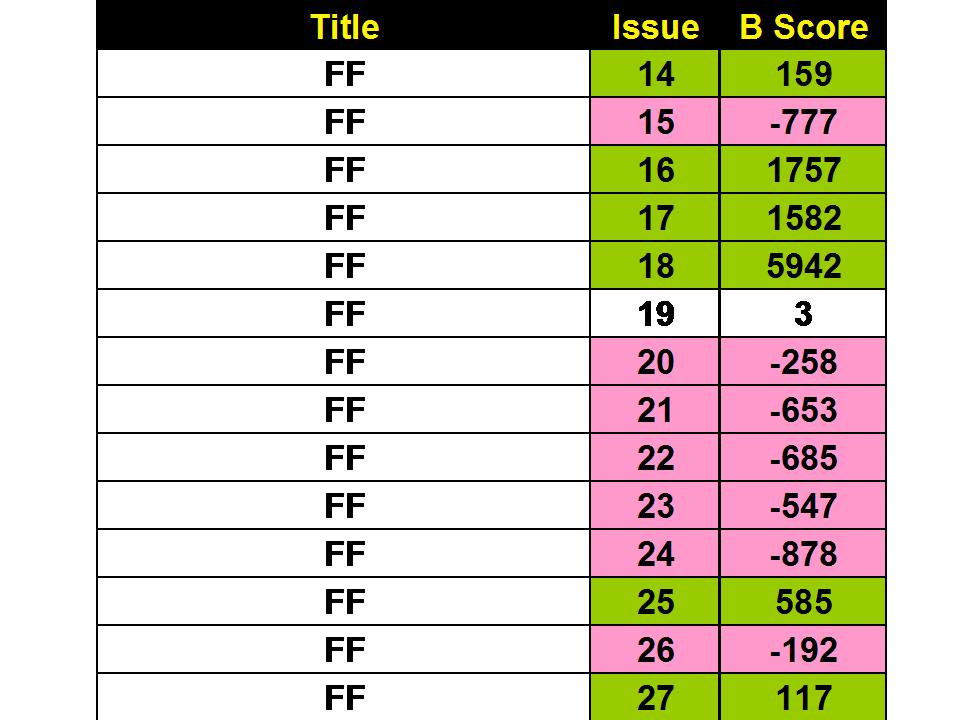
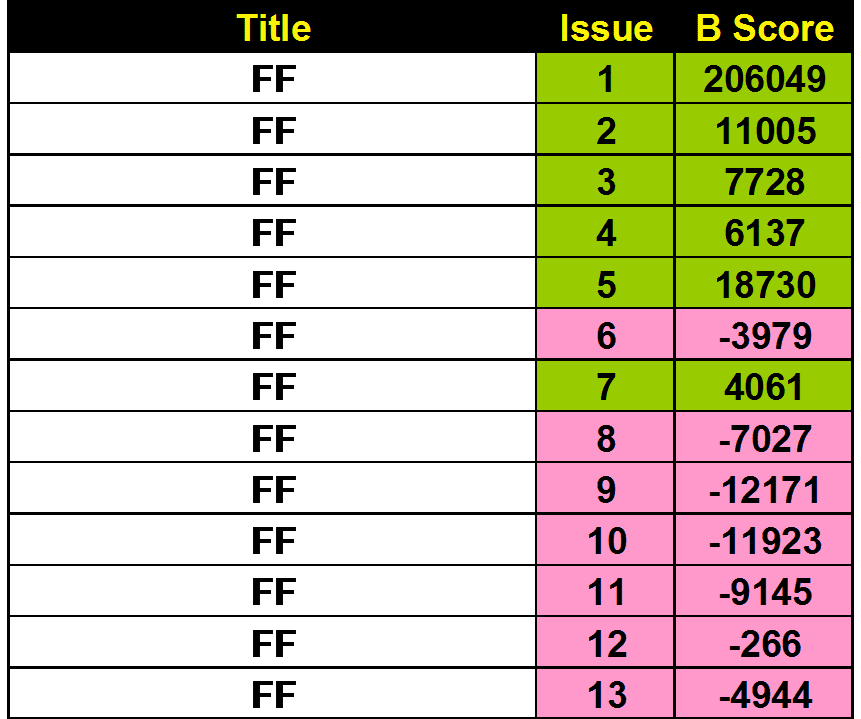
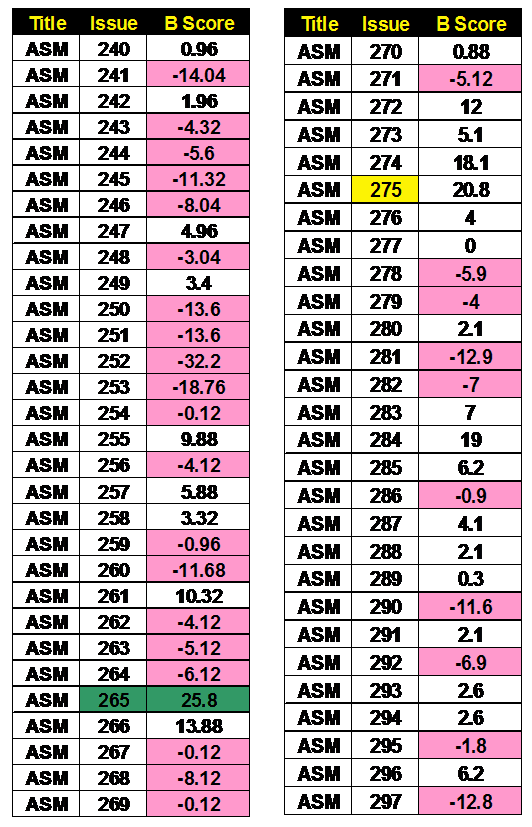
Updated Investment Analysis of Fantastic Four #28 to 44 The first table presents the Bias Score (B Score) for all the issues. Bias scores show which issues are being bought by the Insiders (Pros) vs. the Outsiders (Fans Less Serious).  The concept of my approach is to focus on the issues being bought BULLISHLY by the investors. I developed an analysis of data to quantify this Bias (B Score). I  mark the issues with the highest Bias with Green followed by a Dark Green staining for issues with a lesser but definite Bias. Red are those issues to avoid.  Starting now I am circling back to my early Blog Posts/Data from 2015.  I will add an Extra Figure following the Current Bias information.  See the discussion of the exciting findings!  Table 1 Current Bias Data As It Stands Now In the Table 1A below, I listed the current Bias Scores and the Bias Scores from 2 years ago. I did not do all issues in this issue block and included only the issue that I did in 2015 T

Investment Analysis of Fantastic Four 14 to 27. Which Issue is Hot or Not? Profitable Info?

Image
Updated Investment Analysis of Fantastic Four #4 to 27 The first table presents the Bias Score (B Score) for all the issues. Bias scores show which issues are being bought by the Insiders (Pros) vs. the Outsiders (Fans Less Serious).  The concept of my approach is to focus on the issues being bought BULLISHLY by the investors. I developed an analysis of data to quantify this Bias (B Score). I  mark the issues with the highest Bias with Green followed by a Dark Green staining for issues with a lesser but definite Bias. Red are those issues to avoid.  Starting now I am circling back to my early Blog Posts/Data from 2015.  I will add an Extra Figure following the Current Bias information.  See the discussion of the exciting findings!  Table 1 Current Bias Data As It Stands Now In the Table 1A below, I listed the current Bias Scores and the Bias Scores from 2 years ago. I did not do all issues in this issue block and included only the issue that I did in 2015 T

Investment Analysis of Fantastic Four Issues 1 to 13. Changes in Data from 2015 to 2017. Interesting.

Image
Updated Investment Analysis of Fantastic Four #1 to 13 The first table presents the Bias Score (B Score) for all the issues. Bias scores show which issues are being bought by the Insiders (Pros) vs. the Outsiders (Fans Less Serious).  The concept of my approach is to focus on the issues being bought BULLISHLY by the investors. I developed an analysis of data to quantify this Bias (B Score). I  mark the issues with the highest Bias with Green followed by a Dark Green staining for issues with a lesser but definite Bias. Red are those issues to avoid.  Starting now I am circling back to my early Blog Posts/Data from 2015.  I will add an Extra Figure following the Current Bias information.  See the discussion of the exciting findings!  Table 1 Current Bias Data As It Stands Now In the Table 1A below, I listed the current Bias Scores and the Bias Scores from 2 years ago. I did not do all issues in this issue block and included only the issue that I did in 2015 T

Investment Analysis of ASM 298 to 318. Changes are happening. What are the findings?

Image
Updated Investment Analysis of Amazing Spider-man # 298 TO 318 The first table presents the Bias Score (B Score) for all the issues. Bias scores show which issues are being bought by the Insiders (Pros) vs. the Outsiders (Fans Less Serious).  The concept of my approach is to focus on the issues being bought BULLISHLY by the investors. I developed an analysis of data to quantify this Bias (B Score). I  mark the issues with the highest Bias with Green followed by a Dark Green staining for issues with a lesser but definite Bias. Red are those issues to avoid.  Starting now I am circling back to my early Blog Posts/Data from 2015.  I will add an Extra Figure following the Current Bias information.  See the discussion of the exciting findings!  Table 1 Current Bias Data As It Stands Now In the Table 1A below, I listed the current Bias Scores and the Bias Scores from 2 years ago. I did not do all issues in this issue block and included only the issue that I did in

Investment Analysis of ASM 240 to 297. Still A few issues to look at. Interesting changes.

Image
Updated Investment Analysis of Amazing Spider-man # 240 TO 297 The first table presents the Bias Score (B Score) for all the issues. Bias scores show which issues are being bought by the Insiders (Pros) vs. the Outsiders (Fans Less Serious).  The concept of my approach is to focus on the issues being bought BULLISHLY by the investors. I developed an analysis of data to quantify this Bias (B Score). I  mark the issues with the highest Bias with Green followed by a Dark Green staining for issues with a lesser but definite Bias. Red are those issues to avoid.  Starting now I am circling back to my early Blog Posts/Data from 2015.  I will add an Extra Figure following the Current Bias information.  See the discussion of the exciting findings!  Table 1 Current Bias Data As It Stands Now In the Table 1A below, I listed the current Bias Scores and the Bias Scores from 2 years ago. I did not do all issues in this issue block and included only the issue that I did in 20