Posts

Showing posts from March, 2017

Investment Analysis of ASM 103 to 129. Updated View. Buy Hold or Sell?

Image
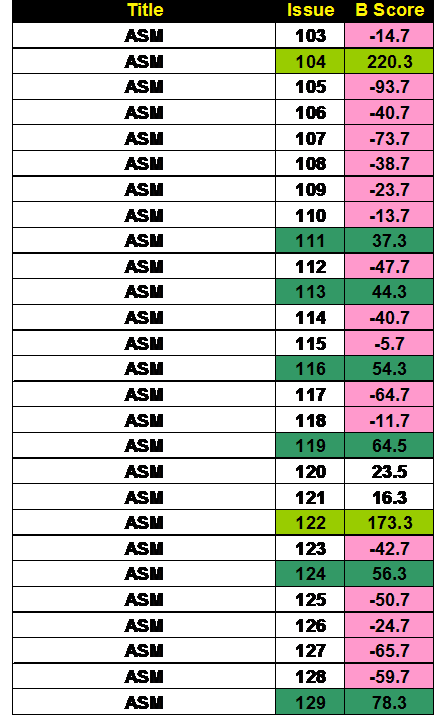
Updated Investment Analysis of Amazing Spiderman # 103 TO 129 The first table presents the Bias Score (B Score) for all the issues. Bias scores show which issues are being bought by the Insiders (Pros) vs. the Outsiders (Fans Less Serious). The concept of my approach is to focus on the issues being bought BULLISHLY by the investors. We developed an analysis of data to quantify this Bias (B Score). We mark the issues with the highest Bias with Lime Green followed by a Dark Green staining for issues with a lesser but definite Bias. Red are those issues to avoid.  Starting now I am circling back to my early Blog Posts from 2015. I will add an Extra Figure following the Current Bias information.  See the discussion of the exciting findings!  In the table below, I listed the current Bias Scores and the Bias Scores from 2 years ago. The changes are calculated and % change was determined. I was surprised at the changes that have occurred. Most of all the issues have increased in

Updated Investment Analysis of Amazing Spiderman # 75 TO 102 Which Issues are a Buy, Sell or Hold?

Image
Updated Investment Analysis of Amazing Spiderman # 75 TO 102 The first table presents the Bias Score (B Score) for all the issues. Bias scores show which issues are being bought by the Insiders (Pros) vs. the Outsiders (Fans Less Serious). The concept of my approach is to focus on the issues being bought BULLISHLY by the investors. We developed an analysis of data to quantify this Bias (B Score). We mark the issues with the highest Bias with Lime Green followed by a Dark Green staining for issues with a lesser but definite Bias. Red are those issues to avoid.  Starting now I am circling back to my early Blog Posts from 2015. I will add an Extra Figure following the Current Bias information.  See the discussion of the exciting findings!  In the table below, I listed the current Bias Scores and the Bias Scores from 2 years ago. The changes are calculated and % change was determined. I was surprised at the changes that have occurred. Most of all the issues have increased in

Investment Analysis of ASM 53 to 74 Updated Analysis from 2015 to Present. Interesting!

Image
Updated Investment Analysis of Amazing Spiderman # 53 TO 74 The first table presents the Bias Score (B Score) for all the issues. Bias scores show which issues are being bought by the Insiders (Pros) vs. the Outsiders (Fans Less Serious). The concept of my approach is to focus on the issues being bought BULLISHLY by the investors. We developed an analysis of data to quantify this Bias (B Score). We mark the issues with the highest Bias with Lime Green followed by a Dark Green staining for issues with a lesser but definite Bias. Red are those issues to avoid.  Starting now I am circling back to my early Blog Posts from 2015. I will add an Extra Figure following the Current Bias information.  See the discussion of the exciting findings!  In the table below, I listed the current Bias Scores and the Bias Scores from 2 years ago. The changes are calculated and % change was determined. I was surprised at the changes that have occurred. Most of all the issues have increased

Investment Analysis of ASM 29 to 52. Updated Data. New Actionable Results.

Image
Updated Investment Analysis of Amazing Spiderman # 29 to 52. The first table presents the Bias Score (B Score) for all the issues. Bias scores show which issues are being bought by the Insiders (Pros) vs. the Outsiders (Fans Less Serious). The concept of my approach is to focus on the issues being bought BULLISHLY by the investors. We developed an analysis of data to quantify this Bias (B Score). We mark the issues with the highest Bias with Lime Green followed by a Dark Green staining for issues with a lesser but definite Bias. Red are those issues to avoid.  Starting now I am circling back to my early Blog Posts from 2015. I will add an Extra Figure following the Current Bias information.  See the discussion of the exciting findings!  In the table below, I listed the current Bias Scores and the Bias Scores from 2 years ago. The changes are calculated and % change was determined. I was surprised at the changes that have occurred. Most of all the issues have increased

Updated Investment Analysis of Amazing Spiderman # 18 to 28.

Image
Updated Investment Analysis of Amazing Spiderman # 18 to 28. The first table presents the Bias Score (B Score) for all the issues. Bias scores show which issues are being bought by the Insiders (Pros) vs. the Outsiders (Fans Less Serious). The concept of my approach is to focus on the issues being bought BULLISHLY by the investors. We developed an analysis of data to quantify this Bias (B Score). We mark the issues with the highest Bias with Lime Green followed by a Dark Green staining for issues with a lesser but definite Bias. Red are those issues to avoid.  Starting now I am circling back to my early Blog Posts from 2015. I will add an Extra Figure following the Current Bias information.  See the discussion of the exciting findings!  In the table below, I listed the current Bias Scores and the Bias Scores from 2 years ago. The changes are calculated and % change was determined. Issues 20, 23, and 27 are the significant issues that have moved up in insiders desire.