Investment Analysis Fantastic Four Issues 45 to 55. Issue 48 has conflicting data which was a surprise.
Updated Investment Analysis of Fantastic Four #45 to 55
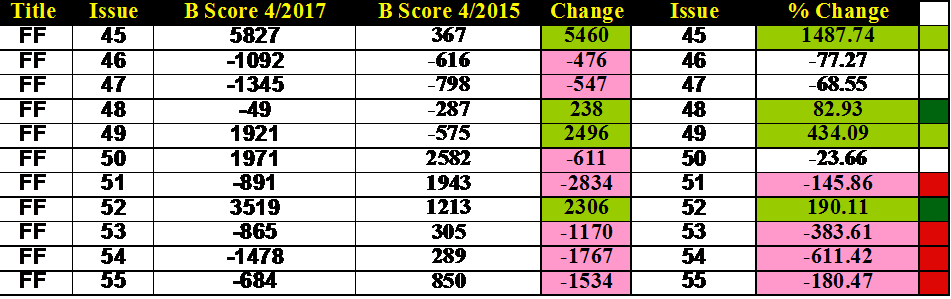
The first table presents the Bias Score (B Score) for all the issues. Bias scores show which issues are being bought by the Insiders (Pros) vs. the Outsiders (Fans Less Serious).
The concept of my approach is to focus on the issues being bought BULLISHLY by the investors. I developed an analysis of data to quantify this Bias (B Score). I mark the issues with the highest Bias with Green followed by a Dark Green staining for issues with a lesser but definite Bias. Red are those issues to avoid.
Starting now I am circling back to my early Blog Posts/Data from 2015.
I will add an Extra Figure following the Current Bias information. See the discussion of the exciting findings!
I will add an Extra Figure following the Current Bias information. See the discussion of the exciting findings!
Table 1 Current Bias Data As It Stands Now

In the Table 1A below, I listed the current Bias Scores and the Bias Scores from 2 years ago. I did not do all issues in this issue block and included only the issue that I did in 2015
The changes are calculated and % change was determined. I was surprised at the changes that have occurred. Most of all the issues have a decreased Insider Bias. (Red Colorization).
This is starting to payoff. I never predicted I would see dramatic changes. Excited to see what is next in FF
All issues have gone up except 46, 47 , 50, 51, 53 , 54 and 55.
In some ways this data mirrors what one might expect. Issues 45, 48, 49 and 52 are the strong issues and interest as a whole has strengthen.
**** Issue 48 has conflicting data. ***
The overall B score was a negative -49 implying that that it as a whole across all the grades is being bought as much by serious vs non serious investors.
"Everybody is interested, everyone knows its a key issue etc"
The 2015 to 2017 change (+238) in Issue 48 is actually a good sign as it suggests the pressure from the non-serious buyers has weaken as they have moved on while the investors are very bullish on it! In 2015 the regular buyers were buying into it as compared to the investing group.
Note that the looking at the Insiders vs Outsiders data in table 2 showed that issue 48 was the second highest on these issues at 1120 and issue 52 was at 1568. These are strong numbers from the general public, they was all over these 2 issues.
Table 3 data looks at the individual grade data separately. Issue 48 is still being heavily bought by the insiders vs outsides within each grade of 9.4, 8 and 6.
Issue 48 is still a buy but other issues such as 49 might be a better bargain for the future.
As I look across different landscapes of data, not all is neat and clear. If investing data was ever clear and neat everyone would be doing the same things.
Consider that data can be murky at times and in the end, all we should do is use it to inspire thinking about our decisions.
Table 1A Comparison of 2015 vs 2017
Bias Data-Changes thru Time.
Bias Data-Changes thru Time.
Table
2 data deals with another data stream on comic-book issues. This run’s
issues are looked at 3 grades 9.4, 8 and 6. The changes in bias between
the different grades are calculated and the SLN numbers were born.
The
SLN numbers look into each “world” of the I vs. O bias data. This data
has shown historically to be the most liberal and establishes the
investment potential across the grades of 9.4, 8 and 6. Very quickly,
the green stained are positive issues and red stained issues are
negative and invite a non-focus in only investments
We
then compare those SLN numbers and generate a difference number we call
the DF. Finally, add the I and O SLN numbers together (total) and
determine the %DF number for each issue. Green staining is good (Higher
Bias) and Yellow and Red are issues that are not good for an investment
focus.
This data stream is more liberal in the rigor and you get the best case for an issue.
Table 2 Bias Overview Data

Dark green stained issues are only biased at the 9.4 grade while the other grades are overbought relative to the professional investor’s desires. Table 3 is the stricter data stream and highlights both the issue and grade. We calculate the average difference (ADF) in Issue Bias between the Insider and Outsiders groups. Lime Green are issues that are I Biased at least 9.4 and 8 grades (High Bias). (Orange $).
The dark green issues are supported with a Bias in 9.4 grade only. The other issues are to be avoided.
ADF Number Table 3

Table
4 is the Score Card information for each issue at the 3 data streams.
This allows a top-down view across the data streams. We denote the
issues supported in all three data streams with a Lime Green staining.
Dark Green has only 2 data streams support and yellow issues are
supported in one data stream only.

I have added my Database Ranking out of 4130 different comic-books.
Table 5 Scaled Desire Ranking.

Comments
Post a Comment