Investment Potential and Analysis of Avengers 113 to 202 Assorted Issues
Investment Potential and Analysis of Avengers 113 to 202 Assorted Issues
The first Table presents the Bias Score for all the issues. Bias scores show which issues are being bought by the Insiders (Pros) vs. the Outsiders (Fans Less Serious). The concept of my approach is to focus on the issues being bought BULLISHLY by the investors.
We developed an analysis of data to quantify this Bias (B Score). We mark the issues with the highest Bias with Lime Green followed by a Dark Green staining for issues with a lesser but definite Bias.
Table 2 data deals with another data stream on comic-book issues. This run’s issues are looked at 3 grades 9.4, 8 and 6. The changes in bias between the different grades are calculated and the SLN numbers were born. The SLN numbers look into each “world” of the I vs. O bias data. This data has shown historically to be the most liberal and establishes the investment potential across the grades of 9.4, 8 and 6. Very quickly, the green stained are positive issues and red stained issues are a negative and invite a non-focus in only investments
We then compare those SLN numbers and generate a difference number we call the DF. Finally add the I and O SLN numbers together (total) and determine the %DF number for each issue. Green staining is good (Higher Bias) and Grey and Red are issues that are not good for an investment focus. This data stream is more liberal in the rigor and you get the best case for an issue,
The deepest level of analysis we developed is the ADF number (average difference between the I/O worlds) of each issue at each grade. I denote a high I Bias with the orange $.
Lime green stained issues are rated I Biased in all grades or at least 9.4 and 8. Dark green stained issues are only biased at the 9.4 grade while the other grades are overbought relative to the professional investor’s desires.
Table 3 is the stricter data stream and highlights both the issue and grade. We calculate the average difference (ADF) in Issue Bias between the Insider and Outsiders groups. Lime Green are issues that are I Biased at least 9.4 and 8 grades (High Bias). (Orange $). The dark green issues are support with a Bias in 9.4 grade only. The other issues are to be avoided.
Table 4 is the Score Card information for each issue at the 3 data streams. This allows a top down view across the data streams. We denote the issues supported in all three data streams with a Lime Green staining. Dark Green has only 2 data streams support and yellow issues are supported in one data stream only.
Table 5 is the last bit of data, the Scaled Desire Ranking. I have grouped 1356 issues of comics that I have covered and developed scaled desire rankings. The percentile that an issue occupies gets wonderful insight into true value between titles. So we position our title and its key issues in context. A score of 99 means that comic issue is desired at the highest level while 1 percentile is the lowest desired issue.
Table 1 Bias Score
Analysis of the B Scores suggest the main show here is 144 with 119, 125 135 and 181 having some value as well.
Issue 144 feature a major comic with the Hell Cat, Beast etc vs Squadron Supreme.
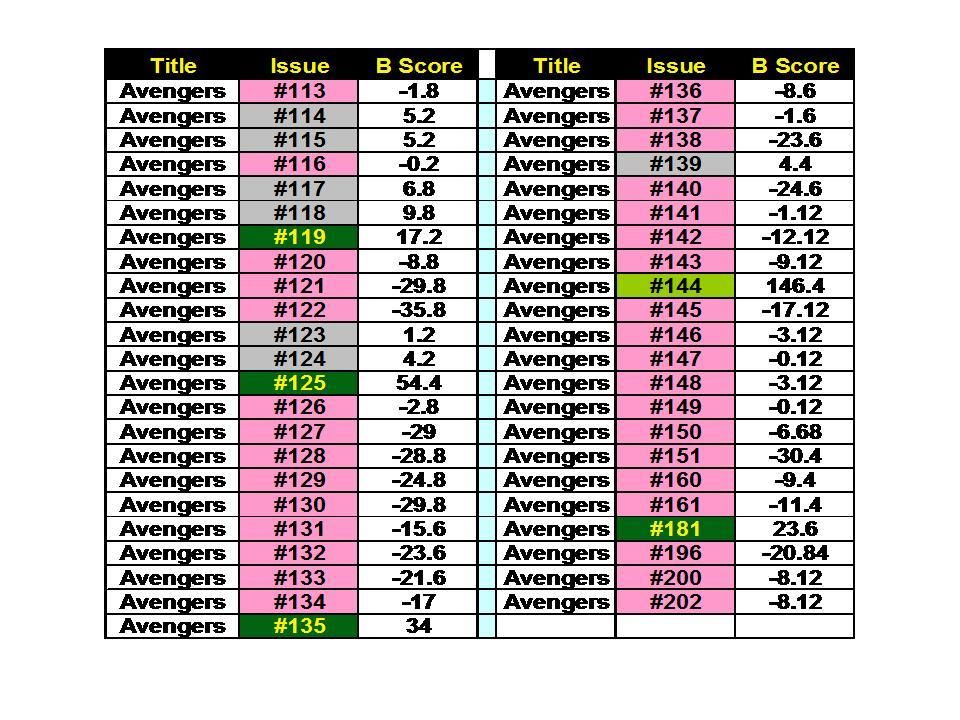
Table 1 Bias Score
Analysis of the B Scores suggest the main show here is 144 with 119, 125 135 and 181 having some value as well.
Issue 144 feature a major comic with the Hell Cat, Beast etc vs Squadron Supreme.

Table 2 DF% and SLN Data.
This data stream usually is the least stringent and will over highlight the issues. Note 141 is still in the top group as well as 144 146 to 149, 181 and 196. We note 181 is highlighted as well in but data streams. This issue is (First appearance) of Scott Lang. This is a post-hype issue?
Table 3 is the stringent data stream that focuses on the grade. Surprisingly, 119, 125, and 144 are supported at the 9.4 grade. We lost 141 here FYI. However 181 and the first taskmaster 196 are the focus at at least 9.4 and 8! Issue 196 is an acquire at grade 6 as well!
Table 3 ADF

Score Card Data reveals that Issues 119 125 135 144 and 181 are the issues that were highlight in all three data streams!. Note 196 was highlighted in 2 streams!
Table 4 Score Card

Table 5 Desire Scale
High Desire Issues here 144 125 135 181 117 to 119.
Note 196 is way down? Confusing. Does that mean its under the radar? We have note seen an issue such as this. I will be watching it!

Comments
Post a Comment