Investment Analysis of ASM 181 to 202. Buy Sell or Hold. Change is happening!
Updated Investment Analysis of Amazing Spiderman # 181 TO 202
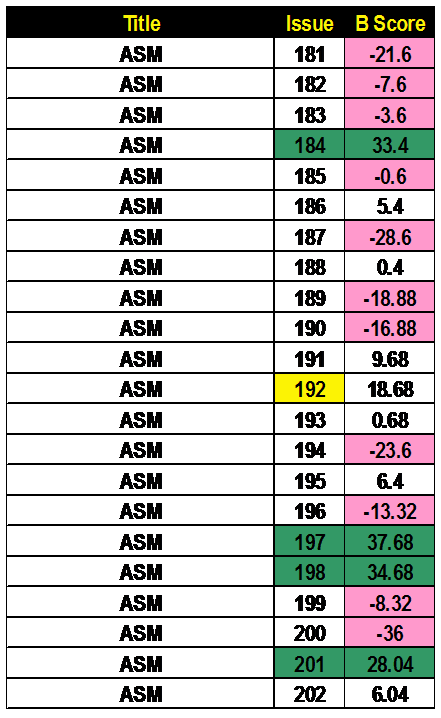
The first table presents the Bias Score (B Score) for all the issues. Bias scores show which issues are being bought by the Insiders (Pros) vs. the Outsiders (Fans Less Serious).
The concept of my approach is to focus on the issues being bought BULLISHLY by the investors. I developed an analysis of data to quantify this Bias (B Score). I mark the issues with the highest Bias with Green followed by a Dark Green staining for issues with a lesser but definite Bias. Red are those issues to avoid.
Starting now I am circling back to my early Blog Posts/Data from 2015.
I will add an Extra Figure following the Current Bias information. See the discussion of the exciting findings!
I will add an Extra Figure following the Current Bias information. See the discussion of the exciting findings!
Table 1 Current Bias Data As It Stands Now
In the Table 1A below, I listed the current Bias Scores and the Bias Scores from 2 years ago. The changes are calculated and % change was determined. I was surprised at the changes that have occurred. Most of all the issues have increased in Insider Bias. (Green Colorization).
This is starting to payoff. I never predicted I would see dramatic changes. Excited to see what is next in ASM.
Interesting to see what has not gone up (ASM 187 and 200 jump out as a Sell) .
The red stained issues are sell type of issues.
Good Buys are 184, 186, 192, 195, 197 198, 201 and 202
Weak Buys are 182 183 185 191, and 199
Trying to get one report out each Wednesday till Fantasy Football Season Cranks up in June.
Table 1A Comparison of 2015 vs 2017
Bias Data-Changes thru Time.
Bias Data-Changes thru Time.

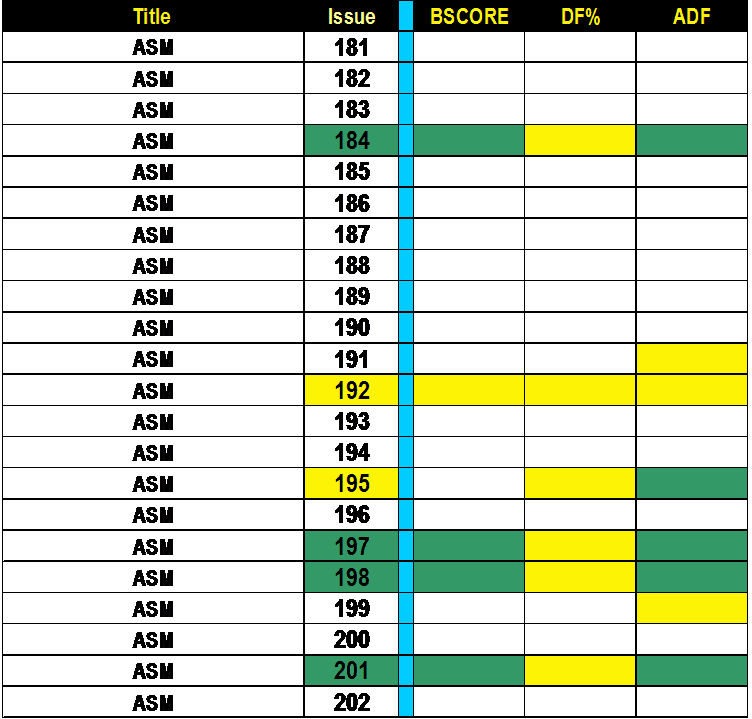
Table 2 data deals with another data stream on comic-book issues. This run’s issues are looked at 3 grades 9.4, 8 and 6. The changes in bias between the different grades are calculated and the SLN numbers were born. The SLN numbers look into each “world” of the I vs. O bias data. This data has shown historically to be the most liberal and establishes the investment potential across the grades of 9.4, 8 and 6. Very quickly, the green stained are positive issues and red stained issues are negative and invite a non-focus in only investments We then compare those SLN numbers and generate a difference number we call the DF. Finally, add the I and O SLN numbers together (total) and determine the %DF number for each issue. Green staining is good (Higher Bias) and Yellow and Red are issues that are not good for an investment focus. This data stream is more liberal in the rigor and you get the best case for an issue.
The deepest level of analysis we developed is the ADF number Table 3 (average difference between the I/O worlds) of each issue at each grade. I denote a high I Bias with the orange $. Lime green stained issues are rated I Biased in all grades or at least 9.4 and 8. Dark green stained issues are only biased at the 9.4 grade while the other grades are overbought relative to the professional investor’s desires. Table 3 is the stricter data stream and highlights both the issue and grade. We calculate the average difference (ADF) in Issue Bias between the Insider and Outsiders groups. Lime Green are issues that are I Biased at least 9.4 and 8 grades (High Bias). (Orange $). The dark green issues are supported with a Bias in 9.4 grade only. The other issues are to be avoided.
Table 4 is the Score Card information for each issue at the 3 data streams. This allows a top-down view across the data streams. We denote the issues supported in all three data streams with a Lime Green staining. Dark Green has only 2 data streams support and yellow issues are supported in one data stream only.
Table 5 is the last bit of data, the Scaled Desire Ranking. I have grouped 4057 issues of comics that I have covered and developed scaled desire rankings. The percentile that an issue occupies gives a wonderful insight into the true value of titles. So we position our title and its key issues in context. A score of 99 means that comic issue is desired at the highest level while 1 percentile is the lowest desired issue. (Green High-Red Low -Yellow staining implies uncertainty- opportunity?)
Table 2 Bias Overview Data
*** FYI I have noticed that within the ASM run the Data from Table 2, Insiders vs Outsiders is more efficient. Zero is prefect efficiency. Red negative issues biased to the Outsiders (Sell) vs Positive Numbers (Green) Insider Biased (Buy) Between the two is the hold zone. Also I am see evidence of movement into these late bronze ASMs. Certainly below 203. Curious to see the next block of issues.


Comments
Post a Comment