Posts

Showing posts from November, 2016

Investment Analysis of Adventure Comics #170 to 200. Interesting group of Comics.

Image
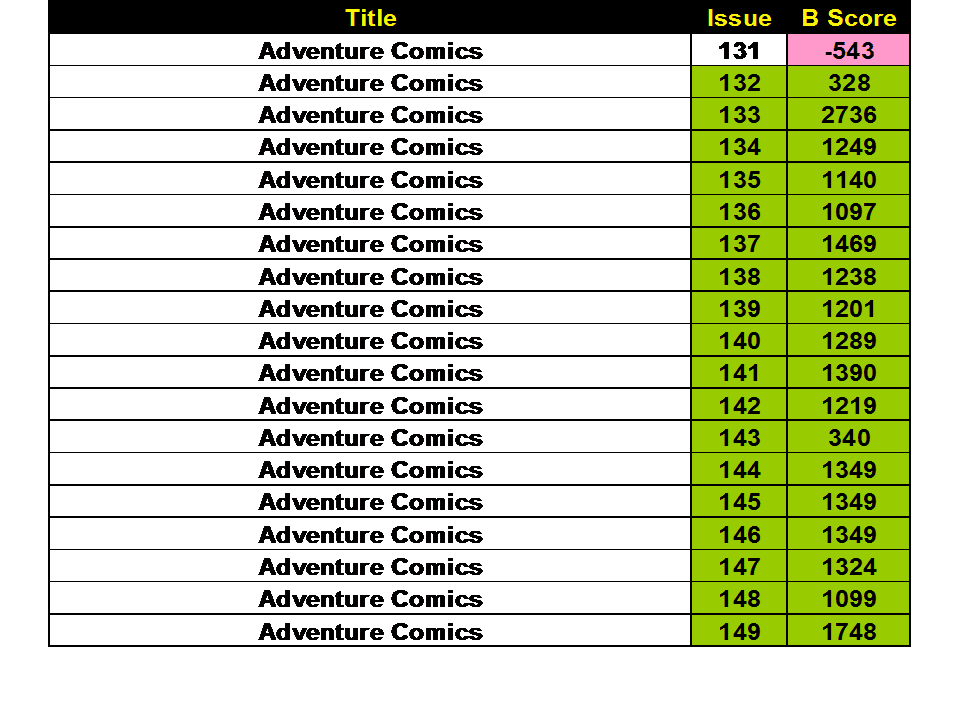
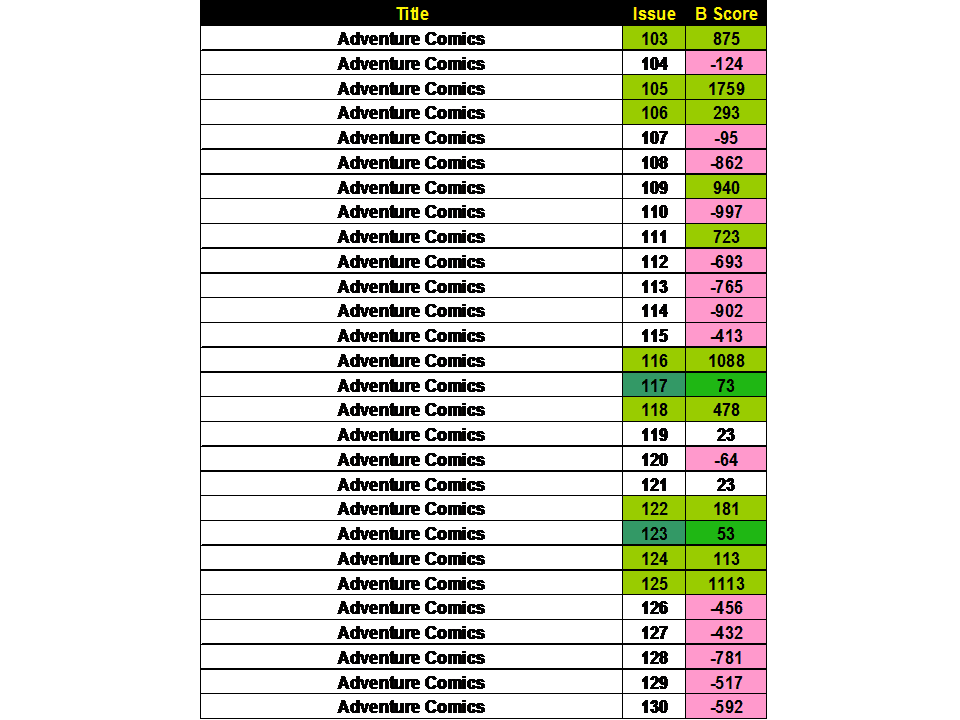
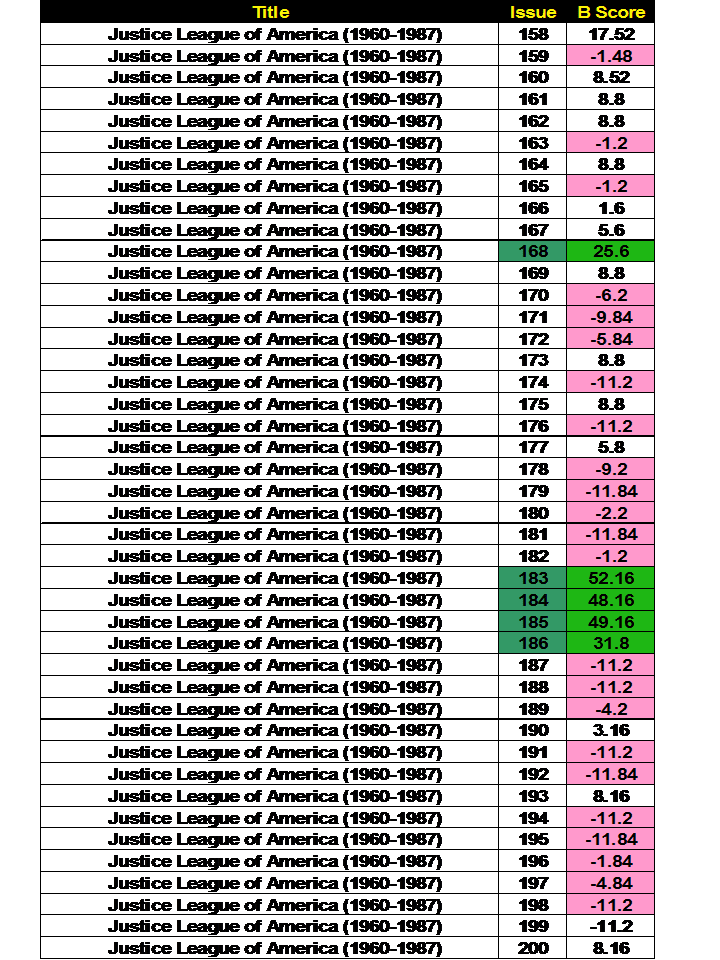
Investment Analysis of  Adventure Comics #170 to 200 Nice Key Issues in here! These seem to be very collectible at 9.4 and above. I wonder when collectible desire takes a back seat to rarity? These issues inspire that question. How do we test that question? The first table presents the Bias Score (B Score) for all the issues. Bias scores show which issues are being bought by the Insiders (Pros) vs. the Outsiders (Fans Less Serious). The concept of my approach is to focus on the issues being bought BULLISHLY by the investors. We developed an analysis of data to quantify this Bias (B Score). We mark the issues with the highest Bias with Lime Green followed by a Dark Green staining for issues with a lesser but definite Bias. Red are those issues to avoid.  Table 2 data deals with another data stream on comic-book issues. This run’s issues are looked at 3 grades 9.4, 8 and 6. The changes in bias between the different grades are calculated and the SLN numbers were born. The SLN

Investment Analysis of Adventure Comics #150 to 169. Interesting group of Comics.

Image
Investment Analysis of  Adventure Comics #150 to 169 Nice Key Issues in here! These seem to be very collectible at 9.4 and above. I wonder when collectible desire takes a back seat to rarity? These issues inspire that question. How do we test that question? The first table presents the Bias Score (B Score) for all the issues. Bias scores show which issues are being bought by the Insiders (Pros) vs. the Outsiders (Fans Less Serious). The concept of my approach is to focus on the issues being bought BULLISHLY by the investors. We developed an analysis of data to quantify this Bias (B Score). We mark the issues with the highest Bias with Lime Green followed by a Dark Green staining for issues with a lesser but definite Bias. Red are those issues to avoid.  Table 2 data deals with another data stream on comic-book issues. This run’s issues are looked at 3 grades 9.4, 8 and 6. The changes in bias between the different grades are calculated and the SLN numbers were born. The SLN

Investment Analysis of Adventure Comics #131 to 149. Interesting group of Comics.

Image
Investment Analysis of  Adventure Comics #131 to 149 Nice Key Issues in here! These seem to be very collectible at 9.4 and above. I wonder when collectible desire takes a back seat to rarity? These issues inspire that question. How do we test that question? The first table presents the Bias Score (B Score) for all the issues. Bias scores show which issues are being bought by the Insiders (Pros) vs. the Outsiders (Fans Less Serious). The concept of my approach is to focus on the issues being bought BULLISHLY by the investors. We developed an analysis of data to quantify this Bias (B Score). We mark the issues with the highest Bias with Lime Green followed by a Dark Green staining for issues with a lesser but definite Bias. Red are those issues to avoid.  Table 2 data deals with another data stream on comic-book issues. This run’s issues are looked at 3 grades 9.4, 8 and 6. The changes in bias between the different grades are calculated and the SLN numbers were born. The SLN

Reasons to Sell a Comic and Comparing the Collector vs. Investor?

Image
Reasons to Sell a Comic Consider this a Positon Paper. I have set out extremes of 100% collectors vs 100% investors. I expect it's a normal distribution of people from the extremes inwards. This figure shows my journey.  A)  Avoid the gamble and focus on a plan “ The reason why many have trouble selling is rooted in an innate human tendency to be greedy. As greed and emotion overcame rational judgment, sound investment principles were replaced by casino-like tendencies.” * * http://www.investopedia.com/articles/stocks/10/when-to-sell-stocks.asp  By Sham Gad     Prospect Theory ** explains some of this tendency. ** “What is the 'Prospect Theory? Prospect theory assumes that losses and gains are valued differently, and thus individuals make decisions based on perceived gains instead of perceived losses. Also known as "loss-aversion" theory, the general concept is that if two choices are put before an individual, both equal, with one presente

Adventure Comics 103 to 130. Nice Key Issues in here!

Image
Investment Analysis of  Adventure Comics #103 to 130 Nice Key Issues in here!  The first table presents the Bias Score (B Score) for all the issues. Bias scores show which issues are being bought by the Insiders (Pros) vs. the Outsiders (Fans Less Serious). The concept of my approach is to focus on the issues being bought BULLISHLY by the investors. We developed an analysis of data to quantify this Bias (B Score). We mark the issues with the highest Bias with Lime Green followed by a Dark Green staining for issues with a lesser but definite Bias. Red are those issues to avoid.   Table 2 data deals with another data stream on comic-book issues. This run’s issues are looked at 3 grades 9.4, 8 and 6. The changes in bias between the different grades are calculated and the SLN numbers were born. The SLN numbers look into each “world” of the I vs. O bias data. This data has shown historically to be the most liberal and establishes the investment potential across the grades of 9.4

Investment Analysis of Justice League of America Issues 158 to 200 Identify Keys of JLA #183 to 186 New Gods / Darkseid / Darkseid Rising /Mister Miracle/ Kirby World crossover

Image
Investment Analysis of Justice League of America Issues 158 to 200 Some Issues to Watch for Growth in the Bronze Age JLA Issues.  #168                           IDENTITY CRISIS precursor #183 to 186                 New Gods / Darkseid /  Darkseid Rising /Mister Miracle/ Kirby World crossover looks to me Like a key block of  issues here!    The first table presents the Bias Score (B Score) for all the issues. Bias scores show which issues are being bought by the Insiders (Pros) vs. the Outsiders (Fans Less Serious). The concept of my approach is to focus on the issues being bought BULLISHLY by the investors. We developed an analysis of data to quantify this Bias (B Score). We mark the issues with the highest Bias with Lime Green followed by a Dark Green staining for issues with a lesser but definite Bias. Red are those issues to avoid.   Table 2 data deals with another data stream on comic-book issues. This run’s issues are looked at 3 grades 9.4, 8 and 6. Th