Adventure Comics 103 to 130. Nice Key Issues in here!
Investment Analysis of
Adventure Comics #103 to 130
Nice Key Issues in here!
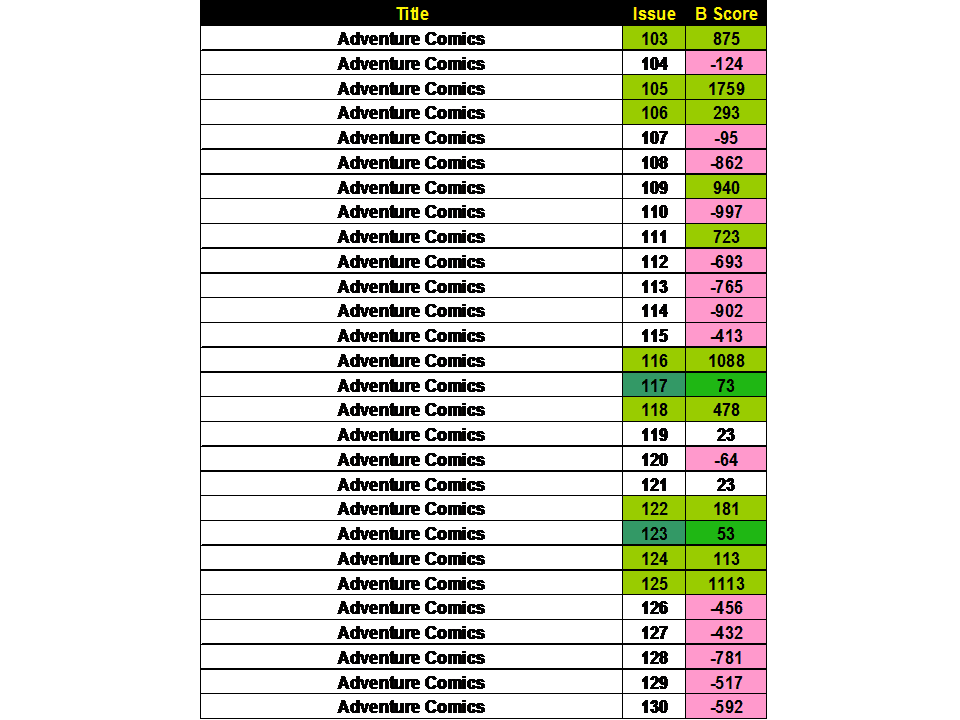
The first table presents the Bias Score (B Score) for all the issues. Bias scores show which issues are being bought by the Insiders (Pros) vs. the Outsiders (Fans Less Serious). The concept of my approach is to focus on the issues being bought BULLISHLY by the investors. We developed an analysis of data to quantify this Bias (B Score). We mark the issues with the highest Bias with Lime Green followed by a Dark Green staining for issues with a lesser but definite Bias. Red are those issues to avoid.
Table 2 data deals with another data stream on comic-book issues. This run’s issues are looked at 3 grades 9.4, 8 and 6. The changes in bias between the different grades are calculated and the SLN numbers were born. The SLN numbers look into each “world” of the I vs. O bias data. This data has shown historically to be the most liberal and establishes the investment potential across the grades of 9.4, 8 and 6. Very quickly, the green stained are positive issues and red stained issues are negative and invite a non-focus in only investments We then compare those SLN numbers and generate a difference number we call the DF. Finally, add the I and O SLN numbers together (total) and determine the %DF number for each issue. Green staining is good (Higher Bias) and Yellow and Red are issues that are not good for an investment focus. This data stream is more liberal in the rigor and you get the best case for an issue.
The deepest level of analysis we developed is the ADF number Table 3 (average difference between the I/O worlds) of each issue at each grade. I denote a high I Bias with the orange $. Lime green stained issues are rated I Biased in all grades or at least 9.4 and 8. Dark green stained issues are only biased at the 9.4 grade while the other grades are overbought relative to the professional investor’s desires. Table 3 is the stricter data stream and highlights both the issue and grade. We calculate the average difference (ADF) in Issue Bias between the Insider and Outsiders groups. Lime Green are issues that are I Biased at least 9.4 and 8 grades (High Bias). (Orange $). The dark green issues are supported with a Bias in 9.4 grade only. The other issues are to be avoided.
Table 4 is the Score Card information for each issue at the 3 data streams. This allows a top-down view across the data streams. We denote the issues supported in all three data streams with a Lime Green staining. Dark Green has only 2 data streams support and yellow issues are supported in one data stream only.
Table 5 is the last bit of data, the Scaled Desire Ranking. I have grouped 3720 issues of comics that I have covered and developed scaled desire rankings. The percentile that an issue occupies gives a wonderful insight into the true value of titles. So we position our title and its key issues in context. A score of 99 means that comic issue is desired at the highest level while 1 percentile is the lowest desired issue. (Green High-Red Low -Yellow staining implies uncertainty- opportunity?)


Comments
Post a Comment