Posts

Showing posts from January, 2016

2845 Silver Age Comics. Look at DC vs Marvel Comics Distribution Across the Desire Scale

Image
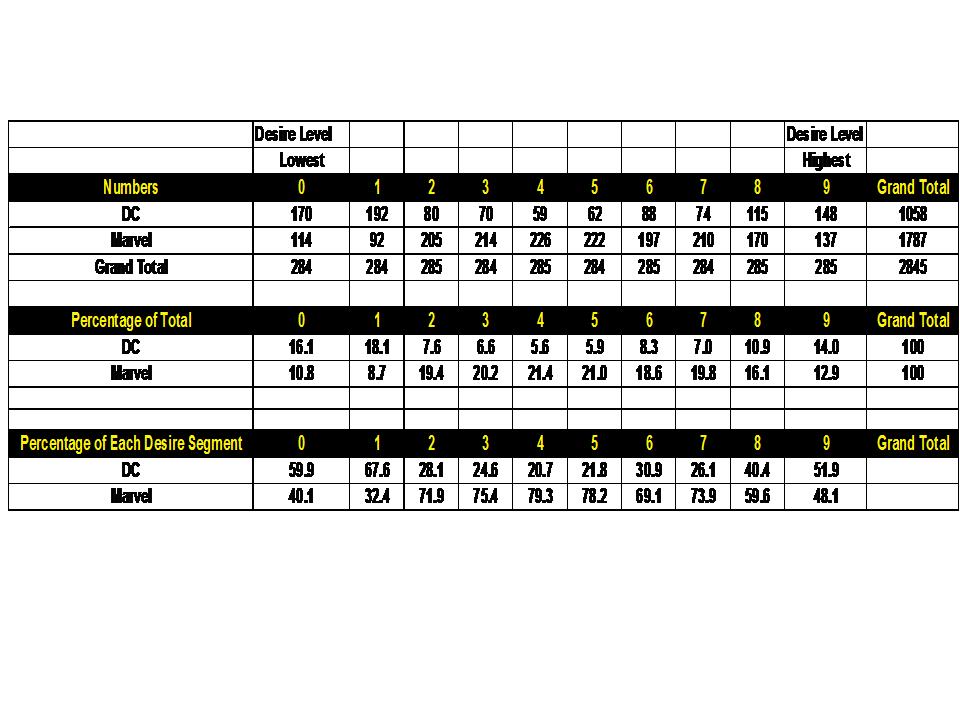
2845 Silver Age Comics.  Look at DC vs Marvel Comics Distribution Across the Desire Scale As a result of my analysis, I am able to estimate each comic book issue's desirability. As seen elsewhere the raw numbers are not normalized distributed. (see 12/20 post).  I do a numerical transformation to approach a more normalized set of data. So I wish to ask a simple question. "Are the comic books from Marvel and DC the same in their distributions across the desirability scale from low to high?" Figure 1 presents the actual raw number of all my database divided by the desirability segments (0 = 0 to 9.99% desirable all the way to the top segment of 9 = 90.0% to 100% desirable)  Figure 2 is a plot of the % of each comic-book company's comics across each segment.  Figure 3 is a plot of the % of each comic-book company's comics within each segment.  I conclude that the investment potential is very different! Collector must be aware of this! I in

Investment Analysis of Action Comics #286 to 320

Image
Investment Analysis of   Action Comics #286 to 320  The first table presents the Bias Score (B Score) for all the issues. Bias scores show which issues are being bought by the Insiders (Pros) vs. the Outsiders (Fans Less Serious). The concept of my approach is to focus on the issues being bought BULLISHLY by the investors. We developed an analysis of data to quantify this Bias (B Score). We mark the issues with the highest Bias with Lime Green followed by a Dark Green staining for issues with a lesser but definite Bias. Red are those issues to avoid.  Table 2 data deals with another data stream on comic-book issues. This run’s issues are looked at 3 grades 9.4, 8 and 6. The changes in bias between the different grades are calculated and the SLN numbers were born. The SLN numbers look into each “world” of the I vs. O bias data. This data has shown historically to be the most liberal and establishes the investment potential across the grades of 9.4, 8 and 6. Very quickly, the gre

Investment Analysis of Action Comics 255 to 285

Image
Investment Analysis of   Action Comics 255 to 285 The first table presents the Bias Score (B Score) for all the issues. Bias scores show which issues are being bought by the Insiders (Pros) vs. the Outsiders (Fans Less Serious). The concept of my approach is to focus on the issues being bought BULLISHLY by the investors. We developed an analysis of data to quantify this Bias (B Score). We mark the issues with the highest Bias with Lime Green followed by a Dark Green staining for issues with a lesser but definite Bias. Red are those issues to avoid.   Table 2 data deals with another data stream on comic-book issues. This run’s issues are looked at 3 grades 9.4, 8 and 6. The changes in bias between the different grades are calculated and the SLN numbers were born. The SLN numbers look into each “world” of the I vs. O bias data. This data has shown historically to be the most liberal and establishes the investment potential across the grades of 9.4, 8 and 6. Very quickly, the green

Investment Analysis of Action Comics 200 to 254.

Image
Investment Analysis of  Action Comics 200 to 254     The first table presents the Bias Score (B Score) for all the issues. Bias scores show which issues are being bought by the Insiders (Pros) vs. the Outsiders (Fans Less Serious). The concept of my approach is to focus on the issues being bought BULLISHLY by the investors. We developed an analysis of data to quantify this Bias (B Score). We mark the issues with the highest Bias with Lime Green followed by a Dark Green staining for issues with a lesser but definite Bias. Red are those issues to avoid.   Table 2 data deals with another data stream on comic-book issues. This run’s issues are looked at 3 grades 9.4, 8 and 6. The changes in bias between the different grades are calculated and the SLN numbers were born. The SLN numbers look into each “world” of the I vs. O bias data. This data has shown historically to be the most liberal and establishes the investment potential across the grades of 9.4, 8 and 6. Very quickly, the gr

Investment Analysis of Brave and Bold 118 to 200

Image
Investment Analysis of   Brave and Bold 118 to 200     The first table presents the Bias Score (B Score) for all the issues. Bias scores show which issues are being bought by the Insiders (Pros) vs. the Outsiders (Fans Less Serious). The concept of my approach is to focus on the issues being bought BULLISHLY by the investors. We developed an analysis of data to quantify this Bias (B Score). We mark the issues with the highest Bias with Lime Green followed by a Dark Green staining for issues with a lesser but definite Bias. Red are those issues to avoid.   Table 2 data deals with another data stream on comic-book issues. This run’s issues are looked at 3 grades 9.4, 8 and 6. The changes in bias between the different grades are calculated and the SLN numbers were born. The SLN numbers look into each “world” of the I vs. O bias data. This data has shown historically to be the most liberal and establishes the investment potential across the grades of 9.4, 8 and 6. Very quickly, the