Posts

Showing posts from May, 2016

Investment Analysis of Flash Issues 220 to 260.

Image
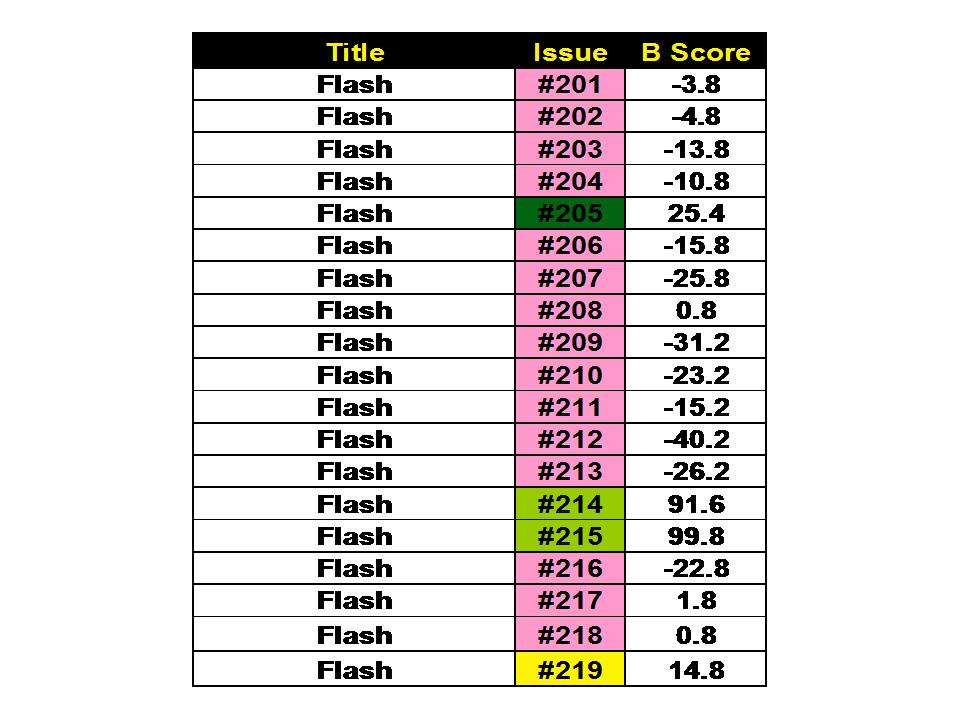
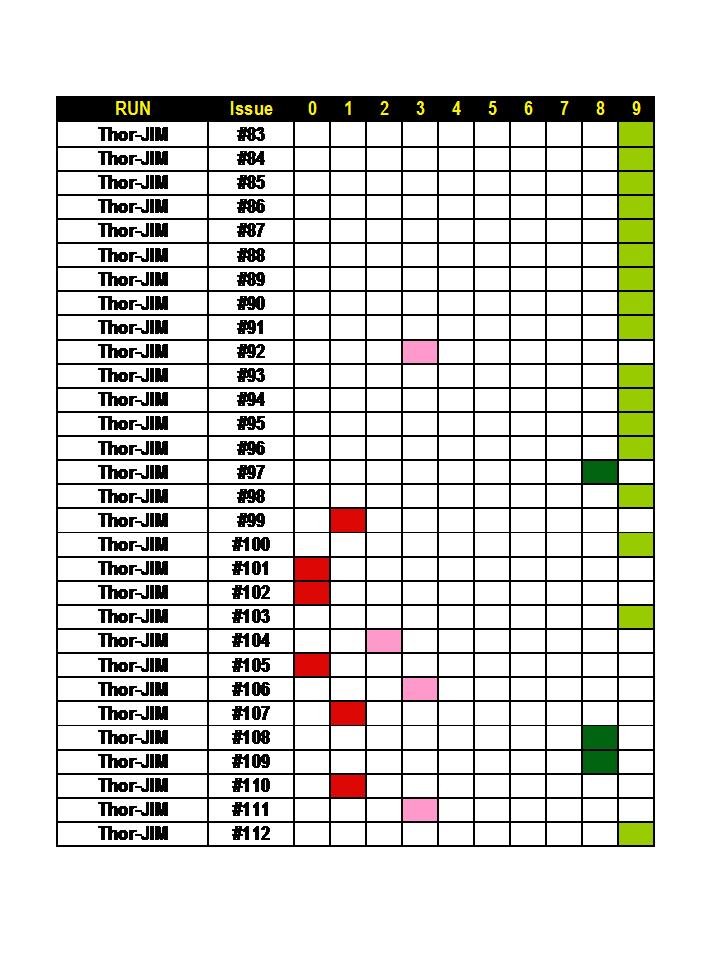
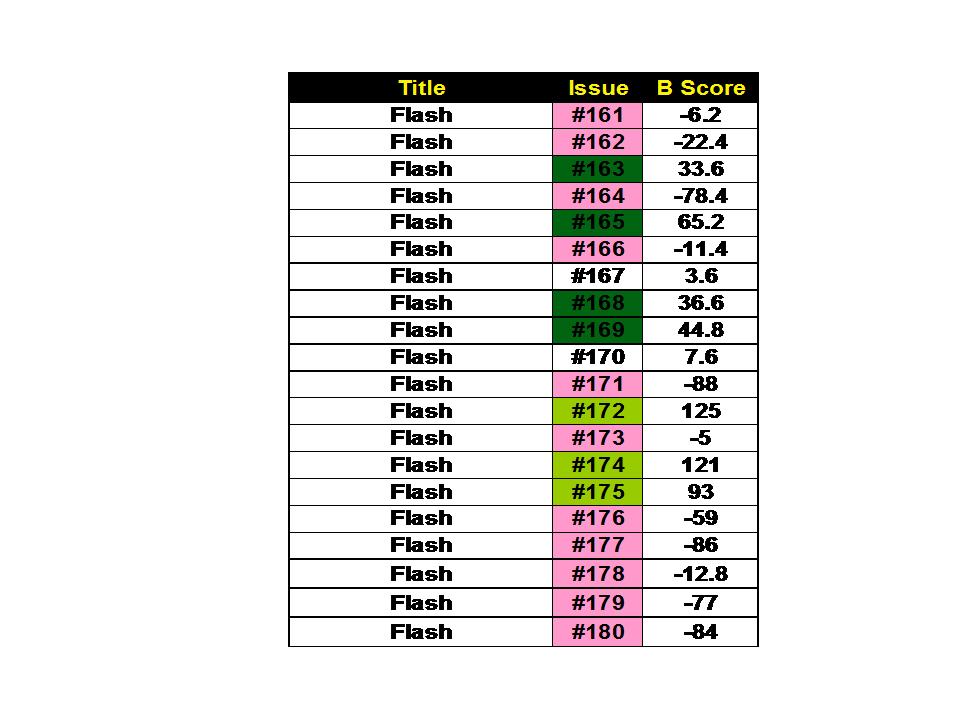
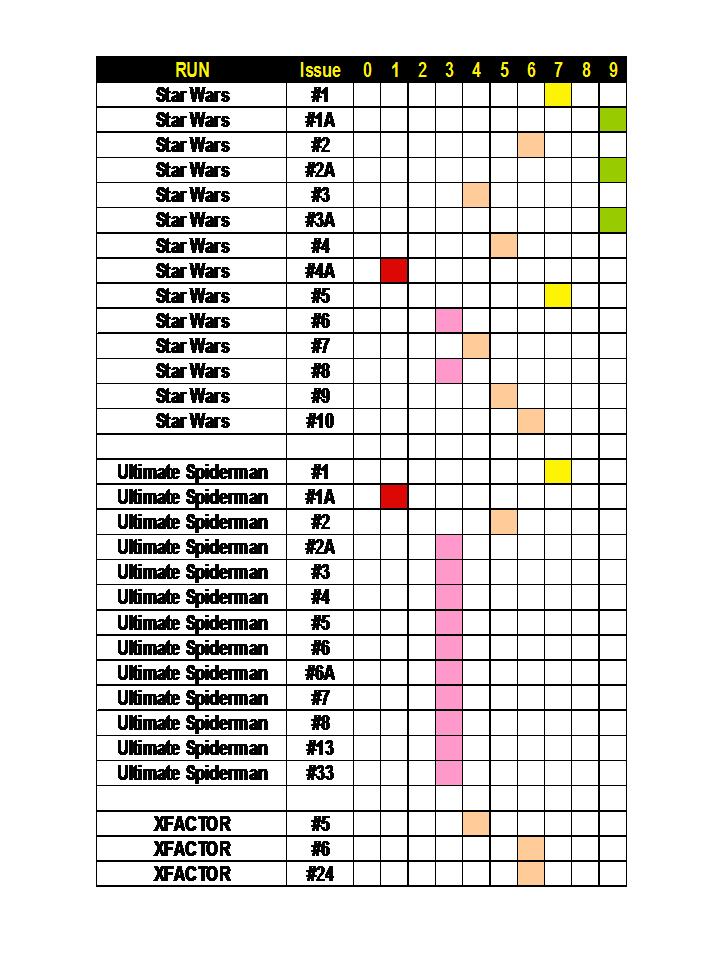
Investment Analysis of  Flash Issues 220 to 260 The first table presents the Bias Score (B Score) for all the issues. Bias scores show which issues are being bought by the Insiders (Pros) vs. the Outsiders (Fans Less Serious). The concept of my approach is to focus on the issues being bought BULLISHLY by the investors. We developed an analysis of data to quantify this Bias (B Score). We mark the issues with the highest Bias with Lime Green followed by a Dark Green staining for issues with a lesser but definite Bias. Red are those issues to avoid.   Table 2 data deals with another data stream on comic-book issues. This run’s issues are looked at 3 grades 9.4, 8 and 6. The changes in bias between the different grades are calculated and the SLN numbers were born. The SLN numbers look into each “world” of the I vs. O bias data. This data has shown historically to be the most liberal and establishes the investment potential across the grades of 9.4, 8 and 6. Very quickly, the green s

Concept Road-Map of My Current Thinking About Comic Book Investing

Image
Concept Road-Map of My Current Thinking About Comic Book Investing This is a completed figure going into my book detailing this road map journey we all love!  Chapter 6. Comic Book Investment Mo Money Portfolios 

Investment Analysis of Flash 201 to 219

Image
Investment Analysis of  Flash Issues 201 to 219 The first table presents the Bias Score (B Score) for all the issues. Bias scores show which issues are being bought by the Insiders (Pros) vs. the Outsiders (Fans Less Serious). The concept of my approach is to focus on the issues being bought BULLISHLY by the investors. We developed an analysis of data to quantify this Bias (B Score). We mark the issues with the highest Bias with Lime Green followed by a Dark Green staining for issues with a lesser but definite Bias. Red are those issues to avoid.   Table 2 data deals with another data stream on comic-book issues. This run’s issues are looked at 3 grades 9.4, 8 and 6. The changes in bias between the different grades are calculated and the SLN numbers were born. The SLN numbers look into each “world” of the I vs. O bias data. This data has shown historically to be the most liberal and establishes the investment potential across the grades of 9.4, 8 and 6. Very quickly, the green s

Investment Ideas #2 : Disposition Effect in Comic Book Investing

Disposition Effect in Comic book Investing   This behavior concerns the tendency of people to hold onto comic issues rather selling and acknowledging how little it is actually worth.  Comic book investors have a tendency to hold onto investments that have fallen in price, regardless of how unlikely it is that they will ever recover in value, rather than selling and acknowledging the loss. The inverse is true, and can be just as damaging: we’re more eager to sell our comics when they are going up, regardless of how much further up they might go. Every price point is not a single point at all but that price point needs to be seen as a distribution of possible future outcomes. A comic's price is not static as changes will occur.  Collectors  hold onto their losers and cut their winners short.  Investors should do the reverse.  Part of your portfolio building process should be to go through your collection on a regular basis, figure out which issues are the winners an

Investment Analysis Flash 181 to 200

Image
Investment Analysis of  Flash Issues 181 to 200 The first table presents the Bias Score (B Score) for all the issues. Bias scores show which issues are being bought by the Insiders (Pros) vs. the Outsiders (Fans Less Serious). The concept of my approach is to focus on the issues being bought BULLISHLY by the investors. We developed an analysis of data to quantify this Bias (B Score). We mark the issues with the highest Bias with Lime Green followed by a Dark Green staining for issues with a lesser but definite Bias. Red are those issues to avoid.   Table 2 data deals with another data stream on comic-book issues. This run’s issues are looked at 3 grades 9.4, 8 and 6. The changes in bias between the different grades are calculated and the SLN numbers were born. The SLN numbers look into each “world” of the I vs. O bias data. This data has shown historically to be the most liberal and establishes the investment potential across the grades of 9.4, 8 and 6. Very quickly, the green s

"Tales from the Database Clues for Profit?" Series Thor 83 to 203 plus assorted other issues Part 22

Image
"Tales from the Database   Clues for Profit?" Series  Part 22 We begin a look back from a top down way at the Comic-book Issues and their B Scores. I use a color coded designation.  Highest Segments of 80% to 100% (8 and 9 segments) in Green. Lowest Segments of 0 to 20% (Segments 0, 1 and 2) with Red. I have used an excel pivot table to gather and present the data.  I present Thor 83 to 203 plus assorted other issues These designations hold until I can recalculate the data. =============================================================== My Textbook for Winning Fantasy Football  Drafting is now for Sale on Kindle.  https://www.amazon.com/author/john_bush $$$$ Read and Plan Now  Crush your Drafts Later!$$$

"Tales from the Database Clues for Profit?" Series Part 21 Superman 102 to 300

Image
"Tales from the Database   Clues for Profit?" Series  Part 21 We begin a look back from a top down way at the Comic-book Issues and their B Scores. I use a color coded designation.  Highest Segments of 80% to 100% (8 and 9 segments) in Green. Lowest Segments of 0 to 20% (Segments 0, 1 and 2) with Red. I have used an excel pivot table to gather and present the data.  I present Superman 102 to 300 These designations hold until I can recalculate the data. =============================================================== My Textbook for Winning Fantasy Football  Drafting is now for Sale on Kindle.  https://www.amazon.com/author/john_bush $$$$ Read and Plan Now  Crush your Drafts Later!$$$

Investment Analysis of Flash Issues 161 to 180

Image
Investment Analysis of  Flash Issues 161 to 180 The first table presents the Bias Score (B Score) for all the issues. Bias scores show which issues are being bought by the Insiders (Pros) vs. the Outsiders (Fans Less Serious). The concept of my approach is to focus on the issues being bought BULLISHLY by the investors. We developed an analysis of data to quantify this Bias (B Score). We mark the issues with the highest Bias with Lime Green followed by a Dark Green staining for issues with a lesser but definite Bias. Red are those issues to avoid.   Table 2 data deals with another data stream on comic-book issues. This run’s issues are looked at 3 grades 9.4, 8 and 6. The changes in bias between the different grades are calculated and the SLN numbers were born. The SLN numbers look into each “world” of the I vs. O bias data. This data has shown historically to be the most liberal and establishes the investment potential across the grades of 9.4, 8 and 6. Very quickly, the green s

Attention Comic Book Friends. My Kindle book on Winning your Fantasy Football Draft is Live

Image
Attention Comic Book Friend. My Kindle book on Winning your Fantasy Football Draft is live. Working on my comic book investment guide as well. FYI Link below http://www.amazon.com/dp/B01F2C15V8

"Tales from the Database Clues for Profit?" Series Part 20 Star Wars, Ultimate Spiderman, and X Factor Assorted Issues

Image
"Tales from the Database   Clues for Profit?" Series  Part 20 We begin a look back from a top down way at the Comic-book Issues and their B Scores. I use a color coded designation.  Highest Segments of 80% to 100% (8 and 9 segments) in Green. Lowest Segments of 0 to 20% (Segments 0, 1 and 2) with Red. I have used an excel pivot table to gather and present the data.  I present  Star Wars, Ultimate Spiderman and X Factor These designations hold until I can recalculate the data. x