Investment Analysis of Fantastic Four Issue 56 to 77. 2015 to 2017 Changes are shown!
Updated Investment Analysis of Fantastic Four #56 to 77
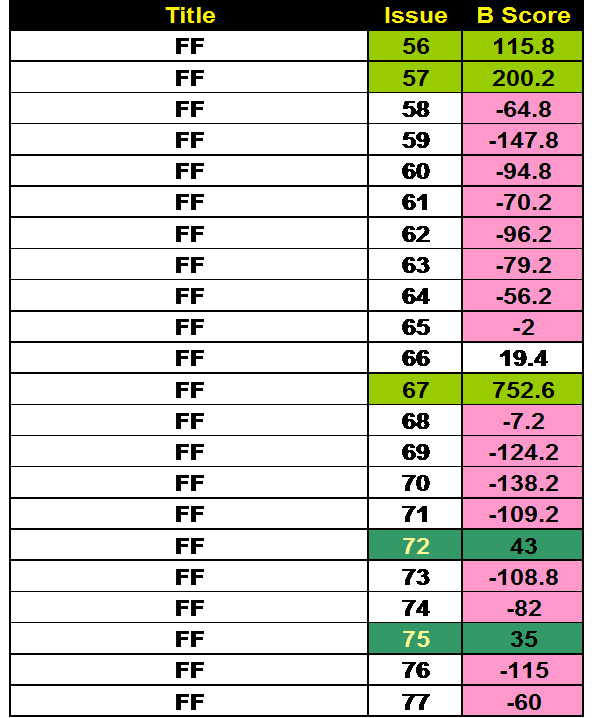
The first table presents the Bias Score (B Score) for all the issues. Bias scores show which issues are being bought by the Insiders (Pros) vs. the Outsiders (Fans Less Serious).
The concept of my approach is to focus on the issues being bought BULLISHLY by the investors. I developed an analysis of data to quantify this Bias (B Score). I mark the issues with the highest Bias with Green followed by a Dark Green staining for issues with a lesser but definite Bias. Red are those issues to avoid.
Starting now I am circling back to my early Blog Posts/Data from 2015.
I will add an Extra Figure following the Current Bias information. See the discussion of the exciting findings!
I will add an Extra Figure following the Current Bias information. See the discussion of the exciting findings!
Table 1 Current Bias Data As It Stands Now
In the Table 1A below, I listed the current Bias Scores and the Bias Scores from 2 years ago. I did not do all issues in this issue block and included only the issue that I did in 2015
The changes are calculated and % change was determined. I was surprised at the changes that have occurred. Most of all the issues have a decreased Insider Bias. (Red Colorization).
This is starting to payoff. I never predicted I would see dramatic changes. Excited to see what is next in FF
All issues have gone down except 56, 66, 67 and 77. The others are a sell or hold for you. The buy signal is squarely on the 4 issues that went up in investors interest.
Issue 56 "Klaw, the Murderous Master of Sound!" I have not clue why the interest?
Issues 66 and 67 are tied to Warlock / HIM (First appearance) (Behind the scenes)
Issue 77 Silver Surfer Galactus Combo plus Psycho-Man
As I look across different landscapes of data, not all is neat and clear. If investing data was ever clear and neat everyone would be doing the same things.
Consider that data can be murky at times and in the end, all we should do is use it to inspire thinking about our decisions.
Table 1A Comparison of 2015 vs 2017
Bias Data-Changes thru Time.
Bias Data-Changes thru Time.

Table 2 data deals with another data stream on comic-book issues. This run’s issues are looked at 3 grades 9.4, 8 and 6. The changes in bias between the different grades are calculated and the SLN numbers were born.
The SLN numbers look into each “world” of the I vs. O bias data. This data has shown historically to be the most liberal and establishes the investment potential across the grades of 9.4, 8 and 6. Very quickly, the green stained are positive issues and red stained issues are negative and invite a non-focus in only investments
We then compare those SLN numbers and generate a difference number we call the DF. Finally, add the I and O SLN numbers together (total) and determine the %DF number for each issue. Green staining is good (Higher Bias) and Yellow and Red are issues that are not good for an investment focus.
This data stream is more liberal in the rigor and you get the best case for an issue.
Table 2 Bias Overview Data

The deepest level of analysis we developed is the ADF number Table 3 (average difference between the I/O worlds) of each issue at each grade. I denote a high I Bias with the orange $. Lime green stained issues are rated I Biased in all grades or at least 9.4 and 8.
Dark green stained issues are only biased at the 9.4 grade while the other grades are overbought relative to the professional investor’s desires. Table 3 is the stricter data stream and highlights both the issue and grade. We calculate the average difference (ADF) in Issue Bias between the Insider and Outsiders groups. Lime Green are issues that are I Biased at least 9.4 and 8 grades (High Bias). (Orange $).
The dark green issues are supported with a Bias in 9.4 grade only. The other issues are to be avoided.
Note Issues 56, 57, 65, 66, 67, and 72 getting love from this data.
ADF Number Table 3

Table 4 is the Score Card information for each issue at the 3 data streams. This allows a top-down view across the data streams. We denote the issues supported in all three data streams with a Lime Green staining. Dark Green has only 2 data streams support and yellow issues are supported in one data stream only.

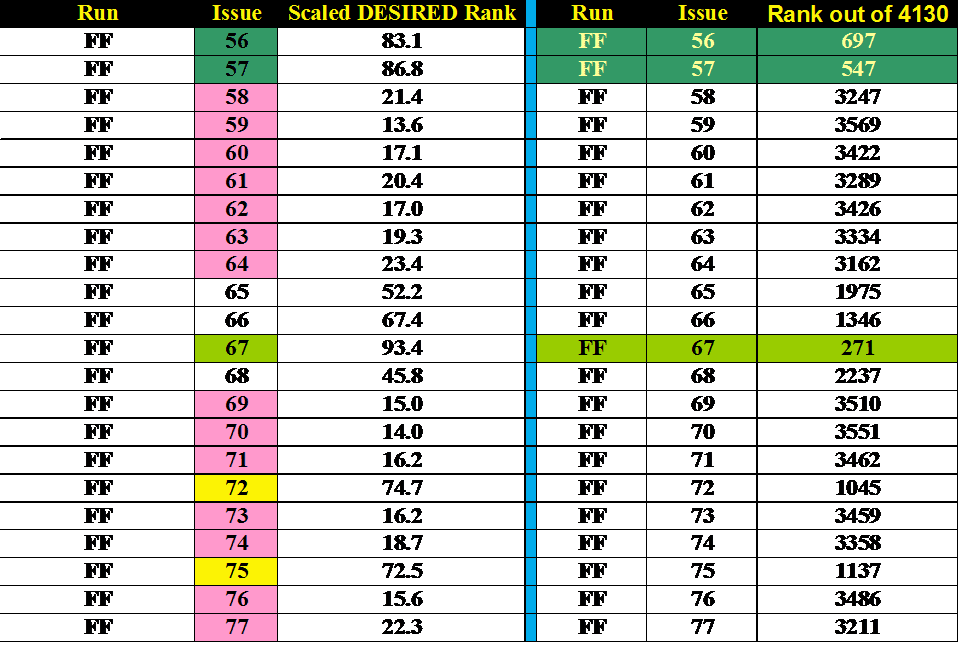
Table 5 is the last bit of data, the Scaled Desire Ranking. I have grouped 4130 issues of comics that I have covered and developed scaled desire rankings. The percentile that an issue occupies gives a wonderful insight into the true value of titles. So we position our title and its key issues in context. A score of 99 means that comic issue is desired at the highest level while 1 percentile is the lowest desired issue. (Green High-Red Low -Yellow staining implies uncertainty- opportunity?)
I have added my Database Ranking out of 4130 different comic-books.
Table 5 Scaled Desire Ranking.
Comments
Post a Comment